Why High Probability Trading is Important for You
Financial decisions can be mathematically appraised; however, most traders make emotional decisions for entering and exiting their trades.

Take the chance and experience:
- How you can focus on trade situations with a higher probable outcome.
- How you can decide for your trades based on numbers, using simple math.
- How you can put together clearly defined trading plans from the chart.
- How you can manage risk and position sizing.
If you are not yet signed up for our Free Trading Tips, Webinars, and Reports, sign up here.
The Odds of Making Money
To appraise and compare trade situations, your system has to give you clear cut entry, exit, and stop rules. In our mentorship, we also teach you, how to repair trades and turning potential losers still into winners. This is actually where our name comes from: Never Stop Loss Trading, but we considered this a bit lengthy and thus NeverLossTrading.
Directional price moves do not last forever; at one point, leading institutional investors will aim to re-balance their inventories by either reducing the offering or flooding supply. This is where many private investors cut their winners short or have a winner turn into a loser; even so they had the price direction right.
To prevent this from happening, we recommend for you to rather trade multiple times if a longer trend develops, taking individual bites off the price development and you do this consecutively for all asset classes: Stocks, Options, Futures, FOREX.
Here is a short appraisal scheme, where you need to know the probability for the setup your system gave you to commence for a pre-defined price move in the desired direction.
Note down one key imperative: Your system shall give you a probability of being right at or above 65%, and we will explain why this is so important.
If you do not know your today’s system probability: Test 100 setups with clear cut entry, exit and stop rules and count the winners and losers. This will give you an idea where you stand.
Key to success: You only trade when the Odds-Ratio > 1.5, calculated as follows:
Odds-Ratio = (Probability for Success x Reward) / (Probability of Failing x Risk)
Let us take a chart situation of our introductory system: TradeColors.com, where you trade with the following conditions:
- A sequence of two newly same colored candles builds the trade setup.
- Entry is above the high of a new blue sequence or below the low of a new red sequence.
- Exit is either at a pre-defined price approximation move: $2.39, in this example or at candle number-5 of the same color sequence.
All candles are colored by an algorithm that identifies up-moves in blue and down-moves in red. Filled candles closed lower than they opened, hollow candles closed higher than they opened.
Graphic-1: BABA, Daily TradeColors.com Chart, January 3 – February 2, 2017
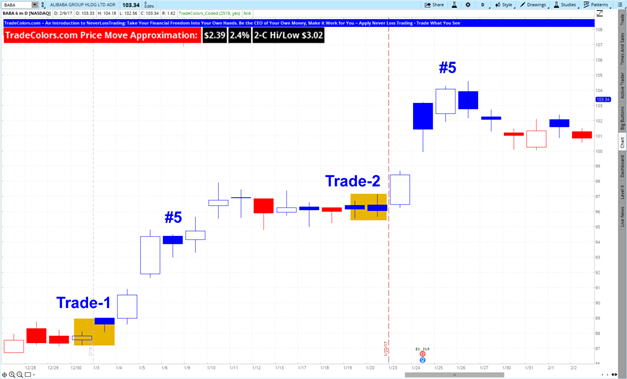
At Trade Situation-1 on the Chart the minimum expected price move was: $2.39 or a 2.4% return on cash. The maximum expected price move, where we exit at candle #5 was $3.02.
How to calculate the odds of Trade-1?
Odds Appraisal: (0.65 x $2.39) / (0.35 x $1.4) = 3.2
Result: The odds are in your favor, you can accept the trade; if you exited your trade at candle #5, you would have produced a price move of $4.88 or a 5.5% return on cash. The return on an exit at candle #5 was above our pre-defined expected maximum price move of $3.02. This shows you, how you can capture opportunities when they arise by following the system.
In Trade Situation-2, you have a similar setup and thus you experience a key imperative of a solid trading system: It shall give you repetitive chart situations to act on.
The odds appraisal depends on two key factors:
- The strength of your trading system.
- The relation of reward to risk at trade setup.
Commonly, moving average-based systems (MACD, Bollinger Band, Stochastic, RSI...) have an attainment rate of about 55%. High probability-trading starts at a 65% attainment rate and very strong systems produce above 75% winners; however, the winning percentage alone does not guarantee trading success. For bringing a directional trade to target, while the price moves in your desired direction, you need to give your trades an adequate wiggle room, which defines the relation of risk to reward in a trade.
Based on our statistics, we experienced the following risk/reward-distribution at trade-setups to bring the trade to target. All calculations are made on a base of achieving $1 reward/risk-unit.
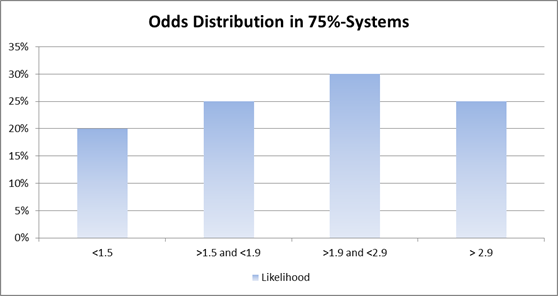
Graphic-2: Likelihood of Reward/Risk-Constellations at Trade Setup
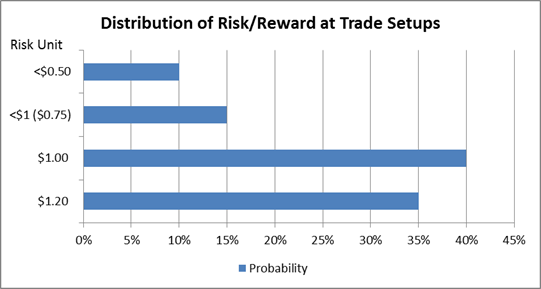
- You have a 10% probability to spot reward/risk setups that have >2-times the reward to risk or <$0.5 risk on an expected $1 reward (top bar)
- In 35% of the cases, you need to give the price-move a >1.2-times-reward-wiggle-room to come to target (bottom bar).
- 40% of the time, you find a 1:1 reward/risk relationship.
- Summing it up: Only in 25% of the cases, at trade setup, you can expect a higher reward than risk.
Key question: How do you find favorable trade setups?
Surely, you can go through hundreds of charts; however, you can also use an alert service, which is helping you to find the specific chart setups you are looking for:
Check out NLT Alerts.
In the next step, we pair the reward/risk-distribution with the odds calculation for a 55%-, 65%-, and 75%-attainment-rate/probability trading system.
Graphic-3: Approximated Odds Distribution by System Probability for a 55%-System
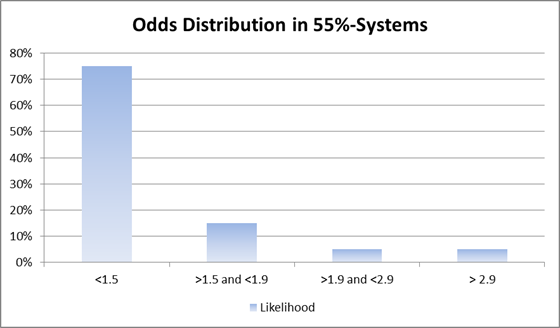
You immediately see where the issue arises: When you are using a system with a 55% probability to spot the right price-direction, in 75% of the trade setups you find, the odds will not be in your favor: Odds-Ratio <1.5.
We hope, you now see the point of why we stress an at or above 65% attainment rate of a system so much for trading with the odds in your favor.
At times we have mathematical skeptics and here is how we calculated:
The Odds-Ratio at a 55% attainment rate and a $1.2-risk at a $1-reward = 1.0 and covers 35% of the trade setups to consider for bringing the price move to target (graphic-2).
+ The Odds Ratio at 55% and a reward/risk of 1:1 = 1.2 and this covers 40% of the happenings.
Calculation: (0.55 x $1)/(0.45 x $1) = 1.2
Adding up 35% and 40% of the happenings, gives you the 75%-bar on the graph, where the Odds Ratio is below the magic number of 1.5; your threshold for making money.
With a 55%-system, you need to find setups above 1.2-times the reward to risk; however, how do you know at trade entry that this ratio is given?
The answer is: You don’t and thus, for making money long-term, you might want to consider moving to a higher probability system, giving you the following:
Graphic-4: Approximated Odds Distribution by System Probability for a 65%-System
|
|
|
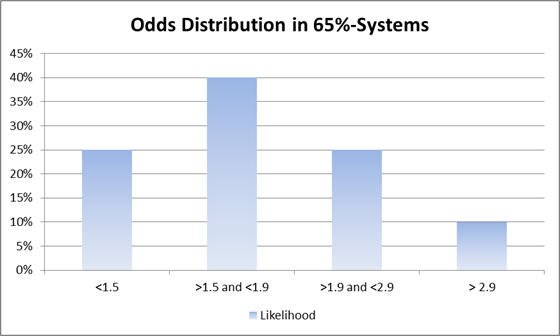
Add up the bars and you immediately see the drastically change a 65% system produces over a 55% system: The distribution of trading with the odds in your favor changed to a 75% likelihood.
Graphic-5: Approximated Odds Distribution by System Probability for a 65%-System
When you are able to trade at a 75% attainment rate, you stacker the odds even more in your favor, by finding 55% trade setups with odds ratios above 2 and you only trade with a 20% likelihood below the magical Odds Ratio of 1.5.
Essence: When you continue to operate with a low probability system (back test it over 100-trades based on clearly set rules), you might still have a positive expectation; however, you are drastically reducing your productivity rate: returns produced over time. Let us explain:
We assume the same amount of signals per observed time-unit, and calculate for the three systems: 55%, 65%, and 75% the productivity rate by relating the participation rate with the odds ratio and probability for success:
Graphic-6: Trading Systems Compared by a Productivity Measure
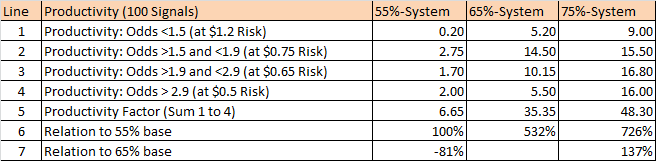
- A 55%-system can have a positive expectation; however, commissions and slippage were not considered in this calculation.
- When you are using a 65%-system over a 55%-system, your productivity rate is 532% higher.
- When you move from a 55%-system to a 75%-system, your trading productivity increases by 726% times.
Earns and Turns is the name of the game: check out our offering…click.
If you are interested in a particular system and you want to experience how our high probability trading systems work live, schedule your personal consulting hour:
Call +1 866 455 4520 or contact@NeverLossTrading.com
System Examples
In all our NeverLossTrading systems and in TradeColors.com, position sizing models are included to quickly appraise trade situations.
When you work with one of the systems, we teach you one-on-one, considering your individual preferences in trading style and your best available times.
In the following, we give you a couple of examples how recent trades worked out.
All our systems spell out at trade entry, how far the minimum expected price move might last. We only trade when the direction of the trade setup candle is confirmed by the next candle ticking out the high or low of the trade-initiation-candle.
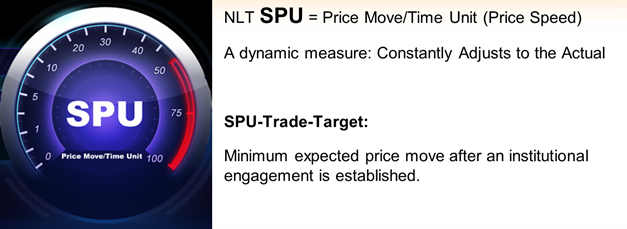
Thus, you can quick-calculate the odds ratio; while we also give you ready-made models on hand where you just fill in numbers. NLT Trend Catching even shows you bar-by-bar a potential trade appraisal in consideration of the expected 1-SPU move (SPU = Speed Unit) and a stop at the red-horizontal-line is drawn on the chart.
Graphic-7: NeverLossTrading Speed Unit Definition
Over the years, we developed multiple systems and many of the NLT traders added some of the systems together to achieve a higher participation rate and productivity of their trading.
To read the expected price move bar-by-bar on the chart, you see the following;
System |
Price Move Approximation |
Reading |
NLT Systems |
|
$4.53 price move from entry: 2% ROC |
TradeColors.com |
|
$2.39 price move from entry: 2.4% ROC |
This way, you know at entry the minimum expected price move of the underlying instrument you trade. NLT Systems for most signals set a target dot on the chart to signify the potential exit. At TradeColos.com you need to set the target mechanically.
Our trading systems work for all asset classes: Stocks, Options, Futures, FOREX.
Please check our offering…click.
If you are interested in a particular system, schedule a live demonstration:
Call +1 866 455 4520 or contact@NeverLossTrading.com
Let us come to some chart examples
Graphic-8: TSLA Weekly NLT Trend Catching Chart, Nov. 2016 to Feb. 2017
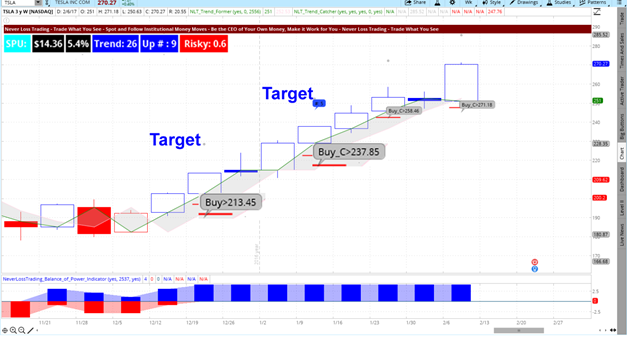
The Speedometer bar shows a SPU of $14.46, meaning that the system calculates an expected price move of $14.36 for the TSLA share if the direction is confirmed, by the next candle ticking higher. This represents a 5.4% return on cash. By the trend information being in blue tells you that TSLA is in an overall uptrend for the last 9-candles.
If you do not like to tie up high amounts of investment capital in one share, we show you how you can follow our signals by trading options, investing only a fraction of the share price: 1-5% and you still participate in the directional price move.
In case you want to start trading with our introductory product: TradeColors.com, you are always welcome to upgrade later, getting every dollar you spent on tuition for TradeColors.com acknowledged on the upgrade.
Teaching one-on-one, you are always receiving an executive service at your best available time and for the assets you are interested to trade or invest in:
Each of your trading sessions is recorded, so you can go through all you learned like a professional athlete, training one-on-one until the learned sits and gets perfected.
How do you appraise, where the overall market is going?
The S&P 500 represent the leading instrument for the overall US stock market appraisal.
Let us take the ETF of the S&P 500 Index: SPY on a daily chart development and using our flagship product: NeverLossTrading Top Line.
Graph-8: NeverLossTrading Top-Line Chart for SPY (magnified buy-/sell indications)
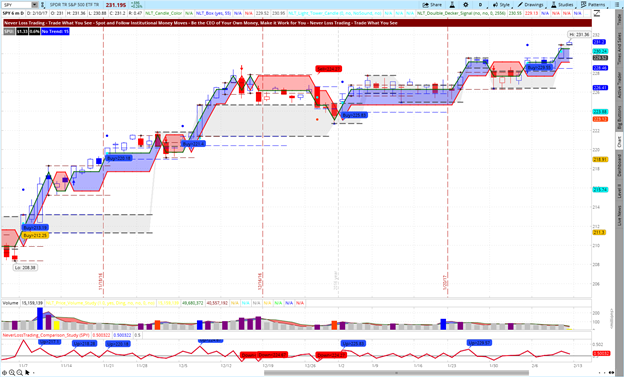
You see multiple directional price move opportunities, where the dot on the chart signifies the expected minimum price move and indeed, when this price level was reached, prices tended to retrace or turn.
Imagine what this can do for your trading, when you can appraise the markets like shown on the chart.
We show you in our mentorships how to read the charts and how to apply multiple trading strategies at various trade setups.
For more information:
Call: +1 866 455 4520 or contact@NeverLossTrading.com
If you are not yet signed up for our Free Trading Tips, Webinars, and Reports, sign up here.
In support of your trading or investing:
NeverLossTrading
A Division of Nobel Living, LLC
401 E. Las Olas Blvd. – Suite 1400
Fort Lauderdale, FL 33301
Disclaimer, Terms and Conditions, Privacy | Customer Support


 US Stock Market Holiday Schedule: